Tuesday, 17 April 2012

Time Domain


Time domain is a term used to describe the analysis of:
·         mathematical functions,
·         physical signals or time series of economic or environmental data, with respect to time.

In the time domain, the signal or function's value is known for all real numbers, for the case of continuous time, or at various separate instants in the case of discrete time.

Tool used to visualize real-world signals in the time domain is oscilloscope.

Time domain graph shows how a signal changes over time, whereas a frequency domain graph shows how much of the signal lies within each given frequency band over a range of frequencies.

The simple manipulation of a signal's time-domain representation is waveform and it can provide a number of useful properties.


Visualization of periodic, aperiodic, and swept-frequency waveforms.


Visualizing a speech signal in the time domain using the Signal Browser interface in the Signal Processing Tool (SPTool).


The most common processing approach in the time or space domain is enhancement of the input signal through a method called filtering. Digital filtering generally consists of some linear transformation of a number of surrounding samples around the current sample of the input or output signal. There are various ways to characterize filters; for example:
§  A "linear" filter is a linear transformation of input samples; other filters are "non-linear". Linear filters satisfy the superposition condition, i.e. if an input is a weighted linear combination of different signals, the output is an equally weighted linear combination of the corresponding output signals.
§  A "causal" filter uses only previous samples of the input or output signals; while a "non-causal" filter uses future input samples. A non-causal filter can usually be changed into a causal filter by adding a delay to it.
§  A "time-invariant" filter has constant properties over time; other filters such as adaptive filters change in time.
§  A "stable" filter produces an output that converges to a constant value with time, or remains bounded within a finite interval. An "unstable" filter can produce an output that grows without bounds, with bounded or even zero input.
§  A "finite impulse response" (FIR) filter uses only the input signals, while an "infinite impulse response" filter (IIR) uses both the input signal and previous samples of the output signal. FIR filters are always stable, while IIR filters may be unstable.
Filters can be represented by block diagrams, which can then be used to derive a sample processing algorithm to implement the filter with hardware instructions. A filter may also be described as a difference equation, a collection of zeroes and poles or, if it is an FIR filter, an impulse response orstep response.
The output of a digital filter to any given input may be calculated by convolving the input signal with the impulse response.

Thursday, 12 April 2012

Frequency Domain :))

Frequency Domain


Definition

  • changes in image position correspond to changes in the spatial frequency
  • this is the rate at which image intensity values are changing in the spatial domain image
  • transform the image to its frequency representation 
  • perform image processing
  • compute inverse transform back to the spatial domain
Methods

FD can be obtained through the transformation from one (time or spatial) domain to the other (frequency) via
  • Discrete Cosine Transform
  • Fourier Transform 
Discrete Cosine Transform (DCT)

It helps to separate the image into parts of differing importance. It is similar to discrete Fourier transform; it transform a signal or image from the spatial domain to the frequency domain.


Basic operation of the DCT is as folows:
  • the input image is N by M
  • f ( i , j ) is the intensity of the pixel in row i and column j
  • F ( u , v ) is the DCT coefficient in row k1 and column k2 of the DCT matrix.
  • for most images, much of the signal energy lies at low frequencies; these appear in the upper left corner of the DCT.
  • compression is achieved since the lower right values represent higher frequencies, and are often small - small enough to be neglected with little visible distortion.
  • the DCT input is an 8 by 8 array of integers. this array contain ah pixel's gray scale level
  • 8 bits pixels have level from 0 to 255.
The One-Dimensional DCT
    
The Two-Dimensional DCT


Fourier Transform (FT)

Brief Description

It is used to decompose image into its sine and cosine components. The output represent the image in frequency domain while the input is the spatial domain. 

Widely used in image analysis image filtering, image reconstruction and image compression.

Properties of the Fourier Transform
  • The FT is a linear operator
  • some other useful properties include


Filtering - scheme


Filtering Example
Smooth an Image with a Gaussian Kernel


Spatial Domain :))


Spatial domain (Image Enhancement)

Definition

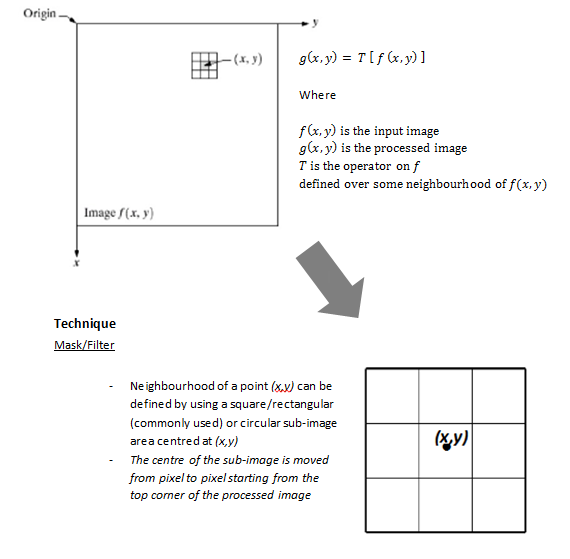
-          Techniques are based on direct manipulation of pixels in an image
-          “normal” image space
-          Changes in pixel positions correspond to changes in the scene
-          Distances in / correspond to real distances
-          Directly process the input image pixel array


-          An image processing operation transform the gray value of the pixels
-          In order to perform the transformation, the image must undergo 3 process
i.                     Point processing  - Gray values change without any knowledge of its surrounding
ii.                   Neighbourhood processing – Gray values change depends on the gray value in a small neighbourhood of pixels around the given pixel.
iii.                  Transform – Gray values are represented in a different domain but equivalent form; Fourier, wavelet.

Point processing

·         Neighbourhood =  1*1 pixel
·          g depends on only the value of f at (x,y)
·         T = gray level (or intensity or mapping) transformation function 
s = T(r) 
where
r = gray level of f(x,y)  
s =gray level of g(x,y)
                Arithmetic Operation
·         Act by applying a simple arithmetic functions

                  s = T(r)

to each gray level in the image
·          T is a function that maps r to s.
·         Additions, subtraction, scaling (multiplication & division), complement

Image Subtraction
g(x,y) = f(x,y) - h(x,y)
  •            Is obtained by computing the difference between all pairs of corresponding pixels
  •            Usefulness: enhancement of differences between images


                Image Negatives


The appearance of photographic negatives


  •           It enhances white or gray detail on dark regions especially when black areas are dominant in size.

Identity function


  •           what “goes in” , “comes out” the same


Log transformation
  •            bring up the details that are not visible due to large dynamic range of values 


Inverse Log Transformation
  •          the opposite of Log transformation
  •       used to expand the higher value pixels in an image while compressing darker-level values.


Power-Law Transformation


Gamma Correction

  •           make linear input appear linear on displays
  •           method: calibration pattern + interactive adjustment


-         
  •      effect gamma on consumer photos


Wednesday, 4 April 2012


How Camera Works

Every camera is essentially a lightproof box, with some method of letting in just a small amount of light at just the right time. The camera start works with:

1.         Once the light is in the box, it forms an image (like in the camera obscura), causes a chemical reaction on photographic film (like in the Brownie camera), or energizes a photocell (like in a digital camera).
2.         when you snap a picture. (You can see right away that a camera obscura wouldn’t do you much good for this kind of picture!)

3.         When press the button on an SLR camera, the mirror flips up exposing the film to the light coming through the lens. One kind of camera which can be either a digital camera or a traditional film camera is called asingle-lens reflex (SLR) camera. In this camera, there is only a single set of lenses for both viewing and photographing an image.

- First, light bouncing off the picture passes into the camera, through a set of lenses, and onto 
a mirror.
– the light bounces up and into a funny-shaped piece of glass called a pentaprism (penta means five, and the pentaprism has, you guessed it, five sides).
-Once light enters the pentaprism, it bounces around in a complicated way until it passes through the eyepiece and enters your eye.


4.         When you press the button on the camera, the mirror flips up out of the way. Instead of bouncing into the pentaprism, light from the picture passes directly to the back of the camera. There, it either hits photographic film and starts a chemical reaction, or else it impacts an array of light-sensitive cells that release a tiny electric charge in each activated cell.
SLRs are not the only camera type.

Many of us use direct vision compact cameras or just “compacts”. In this camera, the lens for viewing is separate from the lens we use to take photographs. Because of the two sets of lenses, compacts don’t need a pentaprism or a hinged mirror, making them smaller and lighter than the SLRs.

Reference:


2. human eye vs camera : similarities and difeferences.

Human eye
Camera
Similarities

Both eye and a camera can adjust quantity of light entering.
Both focus an inverted image onto light-sensitive surface.

Differences
Limitation of resolution
In the eye, this is limited by the density of rods and cones on the retina and fovea. 

Film resolution is limited by chemical grains on the film substrate.
Contrast
Eye is better at determining contrast or differences between light and dark.

Film or digital sensor can adapt to different levels of light just as with human night vision and daylight vision.
Colour
The adaptation of human eye towards light and colour intensity is instantaneous.
The adaptations are more computationally intensive in the digital imaging functions.
Accuracy of focusing
Less accurate than camera
Very high
Image sensor
Far better than camera
Moderate
Time lapse
Human eye can only use the light visible at one instant
A camera lens can create a brighter picture with less light.


References:

Thursday, 29 March 2012

Terms Definition

Sebelum kita menkaji dgn lebih dalam pasal image processing..kita perlu tahu apakah itu image?? apakah itu teknik2 yg terlibat dlm image processing, kepentingan nya dan etc...jgn boring bace! check it out!! 

define an image ??
image adalah 2D function f(x,y) dimana x dan y adalah spatial plane coordinates dan the amplitude of f  at any pair of coordinates (x,y) di panggil intensity or graylevel or brightness of the image at that point.


define brightness ?
brightness of an object dilihat berdasar kan luminance surround. 2 objects tapi berada pada persekitaran yg berbeza boleh mempunyai kadar luminance yg sama tetapi kadar brightness yg berbeza..


define gray level ??
gray level refer to the scalar measure of intensity that range from warna hitam, ke warna gray dan akhir sekali warna putih..


define resolution ??
resolution adalah the smallest number of discernible detail in an image.
spatial resolution is the smallest number of discernible detail in an image.
gray level resolution is the smallest discernible change in gray level. 


define pixels ??
an image is composed of a finite number of elements which has a particular location or value. these elements are referred to as pixels.


define digital image processing ??
the process of digital images by means digital computer. 

  
steps involve in digital image processing..
1. image acquisition
2. preprocessing
3. segmentation
4. representation and description
5. recognition and interpretation


you an go to this link to get more questions and answer in image processing..


Monday, 26 March 2012

Lab 3

Well, what we learned last week?? here's a recap on what we did.

Intensity transformation function

Photographic negative (imcomplement)
-imagine this as turning the black color to white and white color to black. the gradient in between is also reverse. here we turns the white cat to black cat using this code. its vice versa.

>> I = imread('cat.jpg');
>>imshow(I)
>> J=imcomplement(I);
>>figure,imshow(J)


Gamma transformation (imadjust)

>> J1 = imadjust(I,[],[],1);
>> J2 = imadjust(I,[],[],3);
>> J3 = imadjust(I,[],[],0.4);
>>imshow(J1);
>>figure, imshow(J2);
>>figure, imshow(J3);

Algorithmic Transformation (c*log(1+f))
>>imshow(I)
>> I2 = im2double(I);
>> J4 = 1 * log(1 + I2);
>> J5 = 2 * log(1 + I2);
>> J6 = 5 * log(1 + I2);
>>figure, imshow(J4)
>>figure, imshow(J5)
>>figure, imshow(J6)


Contrast-stretching transformation( 1. / (1 + ( m./(double (f) + eps ) ) . ^ E )
>> contrast1 = 1./(1 + (m ./(I2 + eps )).^4);
>>figure, imshow(contrast1)
>> contrast2 = 1./(1 + (m ./(I2 + eps )).^5);
>> contrast3 = 1./(1 + (m ./(I2 + eps )).^10);
>>figure, imshow(contrast2)
>>figure, imshow(contrast3)
>> contrast4 = 1./(1 + (m ./(I2 + eps )).^-5);
>>figure, imshow(contrast4)
>> contrast5 = 1./(1 + (m ./(I2 + eps )).^-1);
>>figure, imshow(contrast5)
>>figure, imshow(I2)
>>figure, imshow(I)


Tuesday, 13 March 2012

Lab 1

In lab 1, we learn how to:
  • read and display an image
  • check how the image appears in the workspace
  • perform histogram equalization on the image
  • write the image to a disk
  • get information about a graphics file
Firstly, to read an image file we use the I=imread('pout.tif'); command. 
The pout.tif according to the image name. 
Then type imshow(I) to show the image file. 
To view the image file size in memory, we used the whos command. 
After that we put the figure, imhist(I) to show the image histogram. 
As we can see, the histogram show that the intensity not cover the potential range of image which is [0, 255].
Then we used the I2 = histeq(I); command to improve the intensity into the full potential range, also improving the contrast. 
After that we can display the image file and the histogram using the figure, imshow(I2) and figure, imhist(I2) command. 
We can see that the new histogram show the pixel value extend across the full range of the possible value.
Lastly, if u want to save the new image file, type the imwrite (I2, 'pout2.png'); command and type imfinfo('pout2.png') to view the image information....

That's all... Thanks you ;)